
The main purpose of an anomaly detection algorithm is to identify atypical data that do not conform to other data.
The problem is not simple. That is because it is not necessarily known in advance what characterises an anomaly. It is therefore up to the algorithm to learn an appropriate metric, with which to detect anomalies within the data.
Use cases encountered by our customers include:
- bank transaction fraud issues;
- the detection of material failures or damage as part of the optimisation of the predictive maintenance framework.
The detection of anomalies is usually an unsupervised learning technique that involves detecting data samples with characteristics which are very different to those of other samples.
For this, a first approach (theorised, for example, by the lean manufacturing and 6 sigma methods) involves calculating the mean and the standard deviation of the data to determine a “probability density” function. This function is then used to calculate the probability of the existence of an atypical sample of data. The rule is as follows: the sample is considered abnormal if this probability is below a certain threshold.
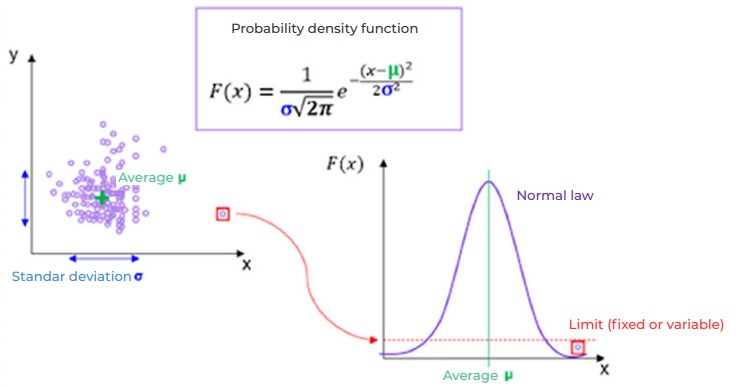
A threshold makes it possible to isolate anomalies – it can be fixed or adaptable. An adaptable threshold is constantly updated and adapts to the data in real time.
These techniques are very effective, but other more modern methods with which to recognise anomalies in data have been developed in recent years.
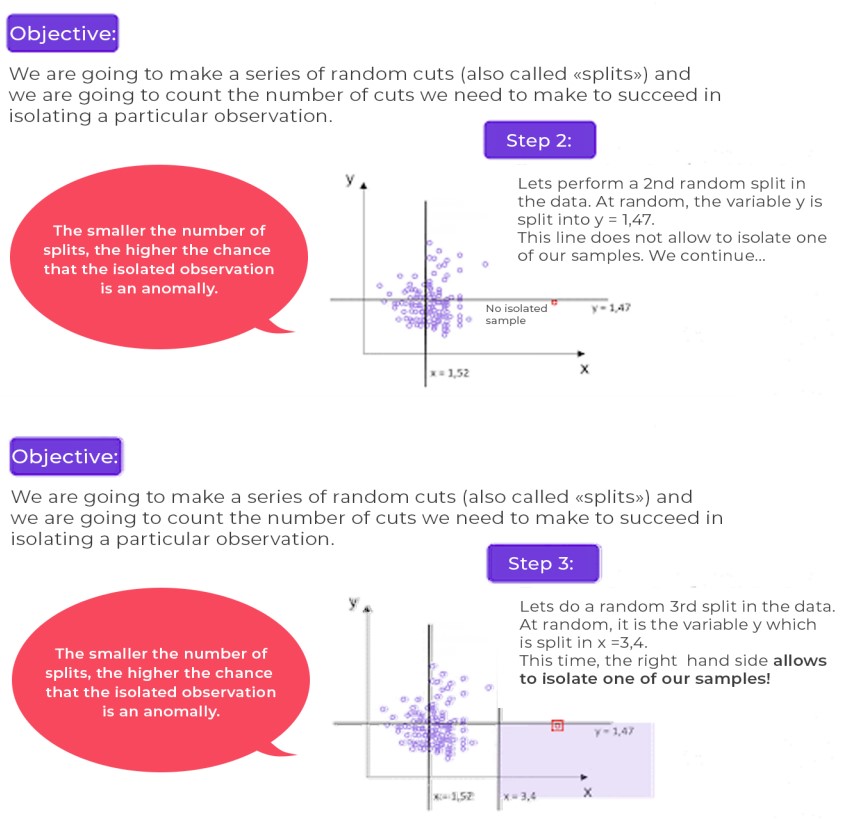
The isolation forest is used to calculate an anomaly score for each observation in a data set. This score gives a measure of the normality of each observation based on the data set. To calculate this score, the algorithm isolates the relevant data in a recursive way. It chooses a variable at random and sets a cut-off threshold at random, before evaluating whether this makes it possible to isolate a particular observation.
This type of algorithm is preferable in the case of a large-scale mathematical problem (with a large number of observations and variables).
Operation illustration
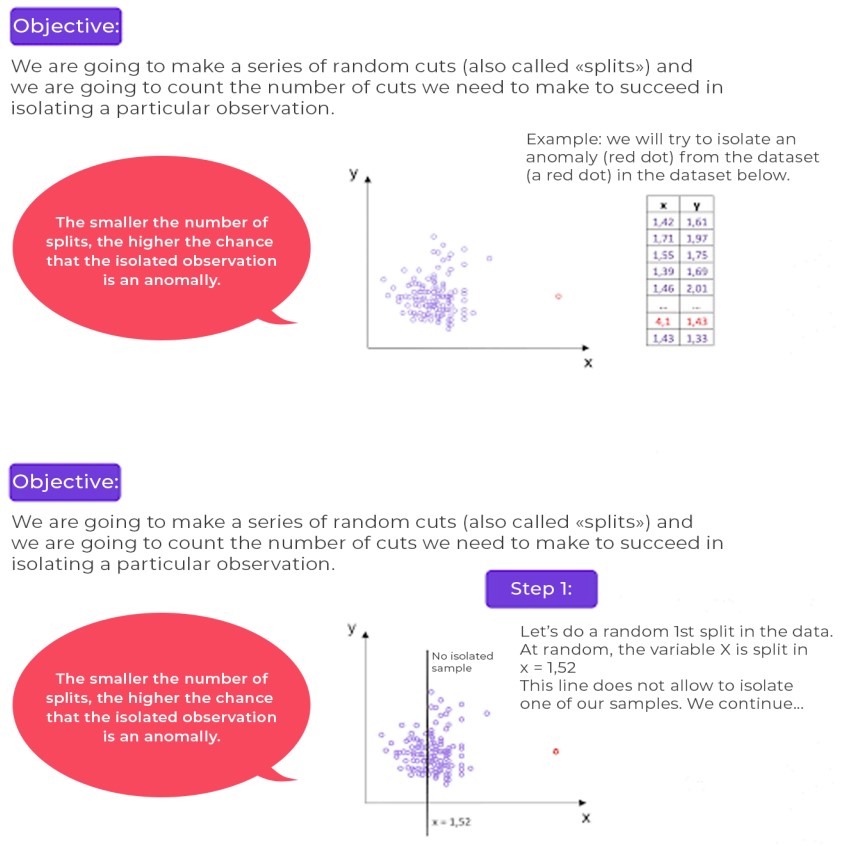
In the following example, forest isolation is applied to data that contains two variables (x and y) and a single anomaly (the extreme point that appears in red on the graph).
Principle of the algorithm
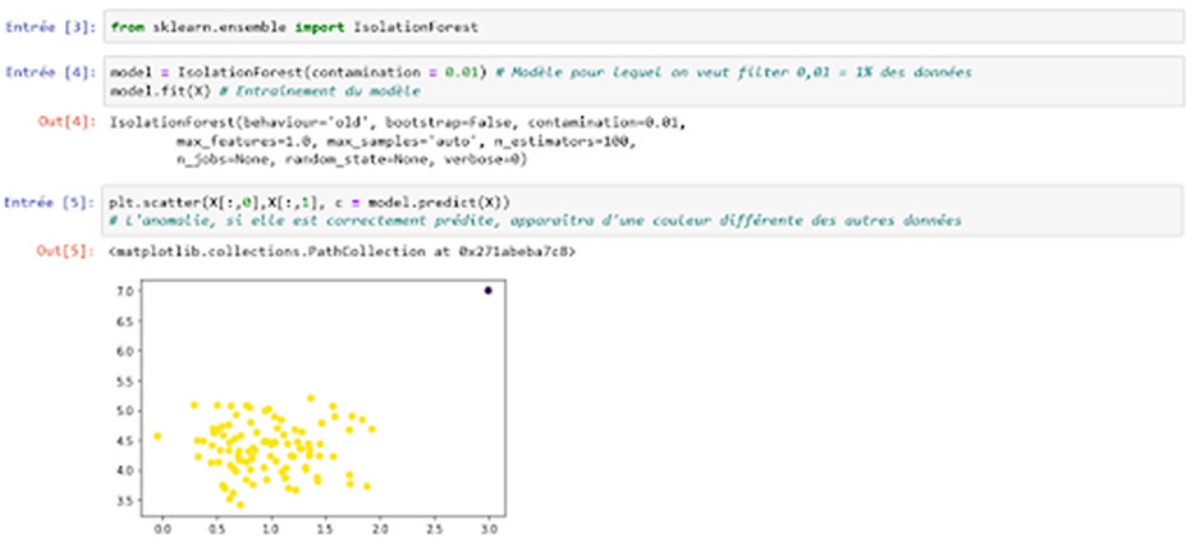
Result : You have understood the idea! In our example, just 3 splits (also known as “separations”) are enough to isolate the sample in red (a supposed anomaly, due to its distance from the other data). However, in the mass of data (i.e. “normal” data), it would have taken perhaps between 100 and 400 splits to isolate a sample.
Remember: the lower the number of splits, the higher the probability that the observed sample is an anomaly.
A forest of trees?
It should be noted that with the random splits process, it is possible to incorrectly isolate a sample from the mass of data (“normal” data). It is unlikely, but it can happen. The solution to overcome this risk of incorrectly isolating a normal sample involves generating several decision trees as estimators. Each of these trees will perform a sequence of random splits. The average of all of the results will then be considered. We can therefore disqualify the few minor errors that can be made by some of these estimators because “the majority will prevail.” Again, ensemble techniques give our results a vital robustness.
Using the algorithm in Python
The sklearn.ensemble.IsolationForest class is used to instantiate a forest isolation model.

Implementation of the isolation forest algorithm
The result is conclusive: the algorithm has understood that there is an outlying point (an anomaly) in the data.
Note that in the implementation of sklearn, the threshold of points to be considered as abnormal is defined by the contamination rate. In our example, the rate of contamination is equal to 0.01 (i.e. 1%). Our data is therefore considered to contain 1% anomalies.
To summarise…
These first three chapters have been devoted to algorithms based on decision trees. These algorithms are widely used, and are extremely effective for solving data problems.
By the way, if you are hoping to work as a data scientist, it is highly likely that interviewers will ask you to describe how one of these algorithms works.

The anomaly score for each observation depends on the “contamination” parameter, which is set during the training phase. This implies that even before constructing the machine learning model, it is essential to have a good idea of the percentage of abnormal data.

